Benchmarks
Latency, utilization, and cold-start numbers — measured, not estimated
All benchmarks run on real inference workloads across H100 and A100 GPU pools. Methodology is published; tests are reproducible.
Latency Distribution
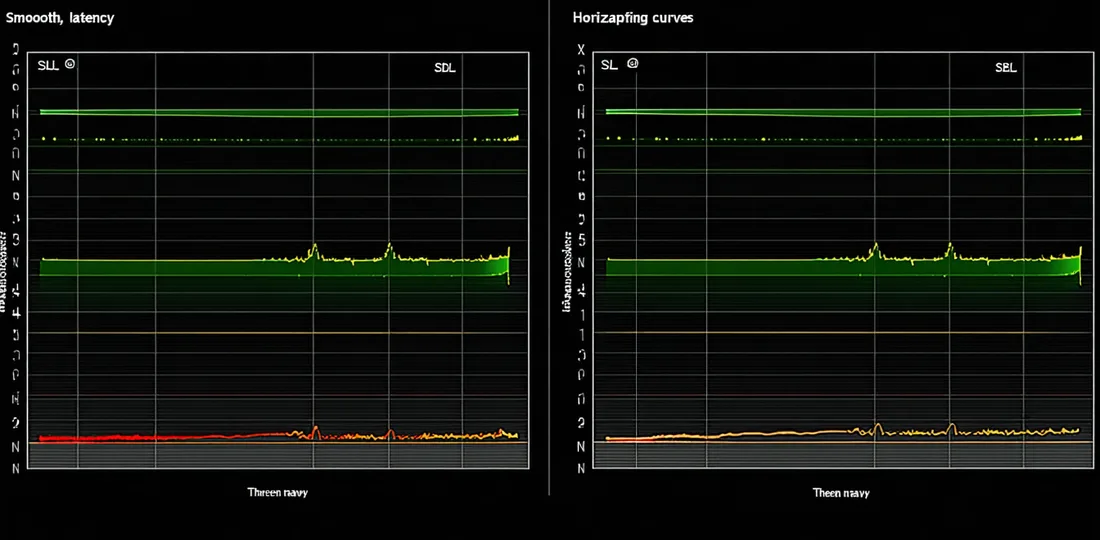
p99 latency under MLSrvyn vs. static provisioning
Recommendation model (two-tower, 50M params) on A100 GPU. Traffic shape: diurnal Bursty archetype. 30-day measurement window. Static baseline: cluster sized for 75th percentile load.
GPU Utilization
GPU utilization with bin-packing vs. one-model-per-GPU
Multi-model fleet: 12 models (mix of 7B, 13B, and 1B parameter sizes) on 8× H100 GPUs. 7-day measurement window. Bin-packing enabled MLSrvyn to co-locate small and medium models on shared GPUs without violating memory constraints.

Cold-Start Elimination
Cold-start rate before and after MLSrvyn deployment
LLM endpoint (Llama 2 70B, FP16, on H100). Measured cold-start events per day over 60-day window. MLSrvyn Steady archetype maintains minimum replicas and drains replicas only during confirmed zero-session windows.
Methodology
Hardware
NVIDIA H100 (80GB SXM5) and A100 (40GB PCIe) instances on standard cloud GPU pools. No dedicated or pre-warmed hardware.
Traffic Generation
Production traffic replay from sanitized logs. Diurnal patterns are preserved. No synthetic constant-rate traffic.
Measurement
Latency measured at the gateway (wall clock, not server processing time). p50/p90/p99 computed from raw histogram data.
Reproducibility
Benchmark configs and data schema are published in our documentation. Teams can reproduce using their own traffic data.
Run these benchmarks on your fleet
Request access and we'll run a free latency profiling session on your actual inference workloads — not synthetic load.